










TL;DR
- Most sustainability evaluations of workplace water programs focus on the bottle. The primary driver of impact is the system behind it: continuous production, transportation, handling, and disposal running month after month.
- Switching from a bottled water program to on-site filtration delivers an average 86% reduction in CO₂ and eliminates an average of 1,115 pounds of waste per dispenser annually.
- The biggest sustainability gains don’t come from making the supply chain greener. They come from replacing it.
Most organizations evaluating the environmental impact of water dispensers focus on the bottle. Is it recyclable? Is it made with post-consumer content? Does the supplier source responsibly? While all reasonable questions, they’re aimed at the wrong part of the problem.
The carbon footprint of workplace drinking water doesn’t live in any one bottle. It accumulates across the full cycle of production, transportation, handling, and disposal that a bottled program requires on a recurring basis.
Every delivery resets that cycle. Understanding what drives the footprint of a workplace hydration program means following the system, not just examining the product.
Reframing Environmental Impact as a System, Not a Product
A commercial water dispenser, evaluated as a standalone product, appears to be a purchasing decision. Evaluated as part of a hydration system that includes supply chains, logistics, and recurring operational inputs, it appears to be an infrastructure decision. The distinction matters because it changes where organizations look for impact reduction.
Lifecycle thinking evaluates production, transport, usage, and disposal as cumulative drivers rather than isolated events. For a bottled program, that cycle is continuous: each delivery represents emissions generated, packaging consumed, and waste created, and the process resets with the next order.
A closer look at how both models work makes the structural difference clear: a bottled system builds recurring procurement into its operating model, while a plumbed dispenser removes that dependency at the point of installation.
As Vivreau’s team has observed, the biggest sustainability gains come from eliminating single-use processes altogether rather than optimizing them. A greener bottle applied to a high-frequency supply chain is still a high-frequency supply chain. The question worth asking isn’t how to make the current model more sustainable. It’s whether the model itself is the problem.
Where Bottled Water Systems Create Hidden Environmental Burden
Plastic water bottles are the most visible consequence of a bottled program, but the picture is broader than packaging alone. Lifecycle analyses of bottled water supply chains identify emissions at every stage of the process: packaging materials, production energy, and recurring delivery cycles each contribute to the total footprint, and each factor compounds with volume and frequency.
Daily delivery logistics illustrate the scale of that last point in commercial settings: food service establishments use an average of 25,000 gallons of water per day, and coordinating that volume through recurring truck deliveries generates transportation emissions that reset with every order.
Operational overhead reinforces the picture. Staff time spent coordinating deliveries, storage space dedicated to inventory, and the administrative burden of vendor management represent indirect costs that accrue monthly. These are not fixed expenses tied to a one-time purchase. They are the operational signature of a supply chain model, and they repeat.
The most common misconception Vivreau’s team encounters is the assumption that bottled programs become sustainable when bottles are labeled recyclable or sourced from greener suppliers. The real footprint lies in the recurring system: continuous production, transportation, handling, and disposal, regardless of what the label says.
What the Data Shows: Quantifying the Impact of Difference
Peer-reviewed lifecycle research consistently finds that the carbon footprint of bottled water is dramatically higher per liter than that of filtered alternatives, driven by the cumulative weight of packaging, production, and logistics rather than by any single factor. Small improvements to bottle composition or recycled content don’t significantly change the number because they address one input in a system where the frequency of the full cycle is the dominant variable.
Vivreau’s cost savings data puts concrete numbers on what the shift looks like. Switching from a pre-bottled program to an on-site commercial water dispenser delivers an average 86% reduction in CO₂ emissions compared to pre-bottled water and eliminates an average of 1,115 pounds of waste per dispenser per year.
The numbers hold at the operational level as well: Auberge Saint-Antoine, after switching to on-site bottling, eliminated 60 truck deliveries annually, along with over 60,000 single-use bottles, a concrete illustration of what removing a supply chain looks like in practice.
CO₂ savings with on-site water filtration at this scale translate directly into measurable reductions in Scope 3 emissions, a meaningful lever for organizations with formal sustainability reporting commitments.
For those tracking progress against net-zero or carbon-reduction targets, the shift also converts an ongoing emissions source into a near-static one. Recurring deliveries stop, and the program’s footprint becomes defined rather than accumulating.
On-Site Filtration as a Lower-Waste System Design
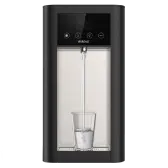
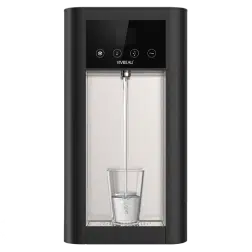
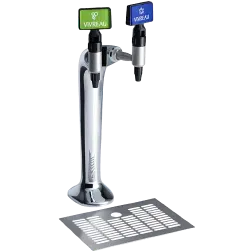
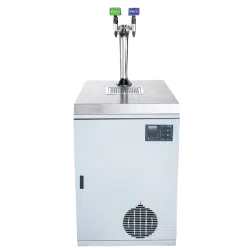
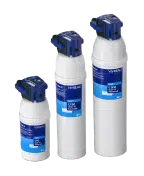
 Office water filtration connected to a building’s water supply replaces a supply chain model with an infrastructure model. There are no recurring deliveries, no plastic water bottles to track or dispose of, and no logistics to coordinate. The water is already there; the system filters and delivers it on demand.
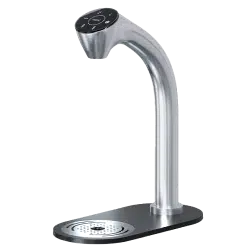
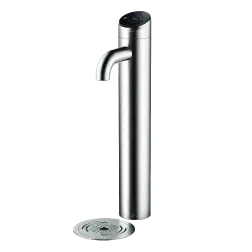
That transition converts a variable, recurring environmental load into a near-static one. A bottleless water dispenser for office use requires filter replacements on a predictable schedule, a fraction of the resource intensity of continuous bottle procurement. Configurations range from countertop units to fully plumbed high-capacity systems, with options suited to different environments and volumes, but the supply chain dependency is gone across all of them.
The operational simplification that follows is a secondary but meaningful benefit. Fewer vendor touchpoints, less service variability, and more predictable costs reduce the management burden on facilities teams while simultaneously reducing the program’s environmental footprint.
A Smarter Path Forward: Measuring and Reducing Impact
For organizations working to reduce the environmental impact of water dispensers across their facilities, the starting point is measurement. Quantifying the current program, including bottles consumed, delivery frequency, and waste generated, establishes a baseline that makes the comparison with on-site filtration concrete rather than directional.
Organizations that work through that baseline often find the business case is more straightforward than expected, because the operational simplicity gains compound the environmental ones.
4ocean recently surpassed 50 million pounds removed from oceans, rivers, and coastlines worldwide. Through Vivreau’s partnership, five pounds of plastic are funded for removal with every dispenser installed, connecting each hydration program upgrade to a measurable downstream impact that goes beyond the facility itself.
Request a quote to assess your current hydration system and quantify the impact of switching to on-site filtration on your organization’s footprint.
Frequently Asked Questions
-
How Can Organizations Accurately Measure the Carbon Footprint of Their Current Water Dispenser System?
A practical starting point is consumption volume: how many bottles or jugs does the program go through each month, and how often do deliveries arrive? Applying standard lifecycle emission factors to packaging, manufacturing, and transportation provides a usable baseline.
Most bottled water vendors can supply delivery frequency and volume data on request. For organizations with formal ESG reporting requirements, switching to on-site filtration produces a clear before-and-after comparison that sustainability teams can use directly in Scope 3 documentation.
-
What Lifecycle Factors Have the Greatest Environmental Impact in Bottled Water Programs?
Packaging materials, production energy, and recurring delivery logistics each contribute to the total footprint, and their cumulative weight compounds with every order cycle. For organizations running ongoing bottled programs, no single factor is responsible in isolation: packaging is produced, transported, consumed, and disposed of on a continuous loop.
The result is a per-liter footprint that is dramatically higher than that of filtered alternatives, and the gap isn’t closed by improving any single input. It closes when the full-cycle frequency is reduced.
-
How Does Eliminating Delivery Logistics Change Scope 3 Emissions Reporting for Businesses?
Delivery logistics from a bottled water program typically fall under Scope 3, Category 4 (upstream transportation and distribution) or Category 1 (purchased goods and services, including packaging).
Switching to on-site filtration eliminates recurring transport emissions and reduces purchased goods emissions to filter replacements only, a small fraction of the original volume. For organizations with committed Scope 3 reduction targets, hydration program optimization is a high-ratio lever relative to the effort required to implement it.
-
What Assumptions Should Be Validated When Comparing Bottled Water vs. Filtration Sustainability Claims?
The most important variable is the baseline. Some comparisons use per-bottle figures without accounting for program frequency; others include transport but omit packaging end-of-life.
A credible comparison should account for full lifecycle emissions per liter consumed, include transportation as a recurring cost, and use actual organizational consumption data rather than industry averages. Recycling assumptions also warrant scrutiny: according to the EPA, less than 9% of plastic generated in the US is recycled in a given year, meaning “recyclable” doesn’t translate to “recycled” at meaningful rates.
-
How Do Maintenance, Filter Replacement, and System Lifespan Affect the Overall Environmental Impact of Filtration Systems?
Filter replacements and scheduled water system maintenance represent the primary ongoing environmental inputs for a point-of-use system, and both are predictable and small relative to the footprint of a bottled program at equivalent volume.
Vivreau’s iQ Solution monitors usage and filter status in real time, enabling service based on actual need rather than fixed intervals, reducing unnecessary replacements and extending system lifespan. Over a dispenser’s full operating life, the total environmental cost of maintenance is a fraction of the annual waste and emissions associated with a bottled program serving the same capacity.


